Remember the LORD for it is he who gives you the ability to produce wealth and so confirms his covenant... Deut. 8:18

Thursday, November 27, 2008

Games Traders Play: Catch that Rally!

Posted By:Daryl Guppy

Volume is the fuel that drives the market. Charts yield clues when volume is out of character. High turnover on a lower close indicates selling pressure -- people want to get out and no one is eager to buy, so the price falls. High volume on a stronger close indicates buying pressure -- people want to get in, but nobody is willing to sell, so buyers must bid higher.

In this installment that looks into the price/volume dynamic, Charting Asia delves into volume activity reflecting a fast moving rally that, if traded correctly, can deliver good short-term profits for low risk before the rally retreats or moves sideways.

Catch That Rally!
Rally behavior is important as it's often the beginning of a change in the trend from down to up. Unfortunately many people think every rally is the beginning of a new uptrend.
A rally provides a five to ten day trading opportunity and must be managed with a tight stop loss. The way volume increases with price, separates a genuine rally from a skilful example of price manipulation in a 'pump and dump' scheme. It also tells the trader when there's a 'dead cat' bounce. These are the rules.

Recognition rules:
· Stock has a history of good trading volume with well defined rises and falls
(Refer the corresponding charts)
· Volume increases for several days
· Price moves slowly, and then accelerates. This is defined with a parabolic trend, or a trend line
· Volume increases as the price begins to move more quickly

Trading rules:
· Enter when price rebounds from the trend line
· Use resistance targets as exit points
· Watch momentum and volume decline. A rapid decline in volume with little change in price is a sure signal of a 'dead cat' bounce.

The Games Traders Play: Pump & Dump

Market volume is very significant in short-term trading. The relationship between price and volume provides a guide to the type of buying or selling activity that is developing.

We kick off by looking at the games traders play.
Traders and investors are constantly playing games in the market. Market volume is a record of such activities. Careful analysis of the relationship between price and volume tells us which game is in play. You keep score by calculating the difference between your entry price and your exit price. What games are out there?

Pump & Dump: This is where desperate individuals play bully with a small stock and use small volume trades to push up price. This price rise is irresistible to other traders and they buy in the hope the price rise will continue. They are tagged when the price manipulator pulls out of the market.
Hide and Seek: This is when an investor tries to build a large position in a stock without causing the price to rise.
Catch that Rally: This is when investors capture a short burst of activity in a fast moving rally that, if traded correctly, can deliver good short-term profits for low risk before the rally retreats or moves sideways.
Pass the Parcel: The game starts with volume based on rumor. The aim of this game is not to be left holding the stock when the rumor is either confirmed or dismissed in the market.

This column details the share manipulation game of Pump & Dump. Here, the manipulator buys a significant volume of shares. Others see the price movement and join the rally. The manipulator then sells to these new buyers and captures a quick profit. The price is 'pumped up' and then the shares are 'dumped' or sold to unsuspecting buyers.

Pump and Dump = Recognition Rules
· Stock has a history of very low trading volume (refer the corresponding charts)
· Volume suddenly increases dramatically and is often associated with just a few trades during the day.
· Price increases by 10% or more
· Very fast price rise is associated with sudden very high volume

· There is no news event that might explain the price rise
· Gap up activity is often followed the next day by a fall in price

Trading rules
· Buy when the price begins to increase on day one. Use intraday charts to identify opportunity
· Sell on day two or day three of the price move
Recognizing the correct price and volume relationship allows traders to make a better decision about the best trading or investment approach to use for the trade.

Identifying Capitulation: How to Tell We've Hit Bottom

Posted By:Daryl Guppy- CNBC.com

Are we there yet? This is the key question and it relates to finding the bottom of the market.

In many ways it's a pointless question. Even if we could identify the turning point in the market with a high level of certainty, there are very few people with the courage to enter at these low points.
The more important thing to look for are the features that will help to identify, first, the end of the market fall and second, the development of a market recovery. These two events may be separated by a few months, or by many months.

There are two important features that identify climax selling. The first is the rapid acceleration in the speed of the market fall. Like a Stuka dive-bomber, the market first rolls over slowly and then plunges in a vertical dive. This is fear at work.
The second feature is a massive increase in volume. This is panic. Ordinary people are desperate to get out of the market. Generally the funds and institutions got out of the long-side of the market many months ago. The selling in January and February was dominated by institutions and funds. The current panic selling is thousands of small orders from retail investors desperate to get out of the market.

During the bear market collapse, volumes decline. Fewer people want to buy stock so volatility increases because small trades have a disproportionate impact in a shallow market.
This selling climax shakes out all the weak hands in the market. It kills the margin speculators. It wipes out those who have finally lost patience. It removes the speculative money in the market because people think the risk is too great. This is also called capitulation. Everybody gives up – and it influences the thinking of a generation. My parents, who lived through the depression, could never entirely shake the idea that the market was a dangerous place.


The activity in the Dow Jones Industrial Average and other global markets shows an acceleration of downwards momentum. The massive increase in volume has not yet developed and this suggests the market bottom is not yet established. There is a high probability that markets will see a selling climax in the next 3 to 5 days. But here is the important difference. The recovery rally after climax selling is temporary. It is part of a longer-term consolidation pattern that may last months, or even a year, and make more new lows before a new sustainable uptrend can develop. The potential shape of the recovery is shown in the chart. The bull market rebound rally follows a temporary selloff. A bear market rebound rally follows climax selling. It is a relief really, but it is not part of a sustainable trend change.
After a bear market, volumes remain low. When you lose trillions of dollars it takes a long time for spare change to start rattling around the economy again. Spare change drives the bull market because money is available for speculation.
In the immediate bear market recovery period the market is dominated by professionals. Finance industry professionals are already being laid off. The least effective are the first to be let go. Only the best will survive the employment washout in the industry and these will be the ones defining the behavior of the consolidation and recovery market.

Ringgit Weakening..?

Morgan Stanley forecasts the ringgit will decline 3.5 per cent to 3.75 per dollar by December 31 and to 4.00 by end-June 2009

INVESTORS should buy so-called “butterfly” options on the Malaysian ringgit in a bet that volatility will rise by year-end as the central bank tolerates a weaker currency, according to Morgan Stanley.The US bank forecasts the ringgit will drop 3.5 per cent to 3.75 per dollar by December 31 and to 4.00 by the end of June as growth in Southeast Asia’s third-largest economy cools and Bank Negara Malaysia cuts interest rates.

A central bank report tomorrow may show gross domestic product expanded in the third quarter at the slowest annual pace in more than three years, a Bloomberg News survey shows.

Public Bank Profit RM1.93bil

Public Bank Bhd (1295), Malaysia's biggest lender by market value, is on track to strong growth this year after earnings expanded 25 per cent in the first nine months, a top official said yesterday.
Managing director Tan Sri Tay Ah Lek also said that the 25 basis points cut in the Overnight Policy Rate (OPR) this week would only have a marginal impact on its net interest margins."Our profit is on track this year. Earnings in the first nine months already grew 25 per cent. It will be around there for the full year. It will be in line with analysts' expectations," he said after an award ceremony in Kuala Lumpur.Its net profit reached RM1.93 billion in the three quarters ended September 30 2008, buoyed by healthy growth in interest income.This brings the earnings per share to 57.4 sen in the nine-month period, from 46 sen last year- NST.

KLCI 870 (+14, +1.6%)

My Gainers = Commerz 5.85/6.05 (3%), Esso 2.00/2.07 (4%), IOI 2.98/3.14 (5%), Mbb 5.05/5.2 (3%) , PPB 8.45/8.40 (1%), Tanjong 12.4/12.0 (3%)

Top Losers = Resort 2.65/2.44(dn0.12, 8%).

Lost Opportunity over the 10 days: KFC 6.60 to 7.30, PetDag 6.60 to 7.20

Saturday, November 22, 2008

Double Cheap Stocks


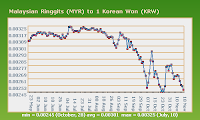
1 AUD = 2.22 MYR, 1000KrW = 2.39 MYR. Monitoring over next week..
Get ready to transact MYR to AUD and KrW for purchase of stocks in Aussie and Korea. It's going to be a double gain. Both stocks and currencies has fallen.
Stocks fallen by 50%. And it's cheaper to purchase now considering the currency fluctuation of 30%.
US market stocks are cheap too. Just beware of currency risk when repatriating your money back to Malaysia. Not a problem if you intend to park your monetary gain in USA for other venture.

A Stock's Price is Rarely the Same as a Company's Value:
The first thing I've learned is that a stock's price is rarely the same as the company's value. The reason for that is the valuation process is flawed. Stock prices are heavily affected by market dynamics and by investors' emotions. These emotions swing widely from pessimism to optimism. Also, many investors buy stocks with the intention of holding them for 1 to 5 years based upon information that really only applies to a short-term time horizon. While the information they are using to invest may be valuable, it is often the wrong information for their investment timeframe. If people invest in a company based on current information, they have to be prepared to act on any changes in that information in a much shorter time frame than most investors are prepared to do. Richard Driehaus

Thursday, November 20, 2008

Currency Play KRW: It's About Time

South Korean won plunges to new multi-year low against dollar and yen on recession fears

(RTTNews) - During early deals on Friday, the South Korean won declined to new multi-year lows against the US dollar and the Japanese yen on escalating concerns that Asia's fourth-largest economy will slip into a recession for the first time since 1998.
As the economic and financial troubles spread, the country's central bank is due to hold an emergency policy meeting next week to decide whether to join a proposed 10 trillion won or $6.57 billion fund to buy bonds issued by local companies.On November 3rd, the South Korean government unveiled a stimulus package worth 14 trillion won to boost the slowing economy. The package includes 11 trillion won fiscal spending next year and 3 trillion won tax benefits. The package also calls for 3.4 trillion won to assist small and medium sized companies and farmers. The ministry said an additional 1.3 trillion won would be spent for low-income earners.
The central bank has also slashed its base rate by 75 basis points to 4.25% from 5% in a series of cuts, including the biggest in its history, from early October, as the global downturn bites into South Korean economic growth.The South Korean economy, Asia's fourth-largest, is slumping hit by a global economic downturn as exports, which account for more than 60 percent of its economic expansion, is faltering on economic recession worldwide.
The South Korean won slumped to 1519.00 against the US dollar during early Asian deals on Friday. This set the lowest mark for the won since March 1998. On the downside, 1644 is seen as the next target level for the won. The dollar-won pair that closed Thursday's North American session at 1496.40 is currently trading at 1509.20.The South Korean won that closed Thursday's North American session at 15.9325 against the Japanese yen declined to 16.0895 at 9:35 pm ET. This set a new multi-year low for the South Korean currency.

1000KRW = 2.45MYR now compared to 3.6MYR two years ago.

S&P 500 @ 752

MALAYSIAN shares are expected to open lower today after the Standard & Poor’s 500 index plunged to its lowest level in 11 years on worsening fears about the US economic slowdown. The Standard & Poor’s 500 Index lost 54.14 points, or 6.71 per cent, to 752.44 after data showed the number of US workers on jobless rolls surged to the highest in a quarter century. “Basically, we are looking at a gloomy, gloomy day for Malaysian stocks. There will be further downside pressure because the S&P 500 crashed to its lowest level since 1997,” said Stephen Soo, technical analyst at TA Securities. “The US government’s possible bailout plan for the auto sector will definitely affect market in the region and we will not be able to escape that regional selldown,” he said.
The Dow Jones industrial average plunged 444.99 points, or 5.56 per cent, to 7,552.29. The Nasdaq Composite Index slid 70.30 points, or 5.07 per cent, to 1,316.12. - Reuters

Wednesday, November 19, 2008

AUD & KRW Currency Play


From recent peak, AUD currency has drop by 30% while KRW has drop by 28%. GBP also has fallen 28%. Time to buy...?
I think commodity currencies AUD, BRR will descend further and so will export currency KRW. Hold your horses just a bit longer..
Approximate Rate: 1 AUD = 2.3 MYR, 1000KRW = 2.5MYR
http://www.forexcult.com

Risk Control & Size Positioning

5 years low since 2003. DJIA down 457 (5%) to 7997 with S&P500 down 52(6%) to 806 points: 3390 losers and 303 gainers were registered.
Auto industryin trouble, consumer spending down, energy down 9%.
Oil at 22 months low.

For reader interested in position sizing:
http://turtleinvestor888.blogspot.com/2008/08/art-of-risk-control-position-sizing.html
Suppose you have RM100,ooo capital and you wants to buy/sell stock shares but is willing to lose only up to RM10,000. Then what is the size of your position in the stock market given a risk control loss?

1. Set up a cut loss line. If your risk loss is 20% tolerance, that means you can take a position up to RM50,000. The Rm50,000 is the size of your stock investment/trading. In any event of a sharp value decline of your stock holding by 20%, you lose only RM10,000.
But if your tolerance is 10%, then you can actually position the size of your whole capital of RM100,000 to buy shares. In any event of loss, it is restricted to RM10,000.

So say you bought IOI Corp share at RM4 x 25000 shares and unfortunately the market declines. Share now goes down in price. Your cut loss is 10% and you should sell when price drops to RM3.60 thus preserving your capital: 25ooo shares x RM3.60 = RM90,000.

2. Assuming you quit the stock market and place your reduced capital of RM90,000 with a bank earning deposit interest of 3.75%, it will take 3 years for your placement to revert back to RM100,000.

Sunday, November 16, 2008

S&P500 chart


Someone say S&P 500 is a better indicator of trend as it is more broader reflection of the American economy.
On Friday, it closes down 38 points (4.2%) at 873. Materials and financials were weak.

Tuesday, November 11, 2008

Commodity Currencies Down

Fears about a global slowdown weigh on the markets.
Commodity Index down 1% to 257, Gold down 2% to USD728, Crude Oil down 5% to USD59.
DJIA down 3% to 8600 at 12.20pm
Commodity currencies all down with AUD and NZD losing 3%
USD Index strength at 86.8

LONG TERM PLAY?


Monday, November 10, 2008

KLSE vs DJIA